It’s me again, Danielle Butterfield, Executive Director and President of Priorities USA. If you’re like me and spend most of your time around political junkies, strategists, and staffers, it’s easy to get trapped in a bubble—either believing we live on a totally different internet than the voters we’re trying to reach or assuming our own media habits are the norm.
So I decided to see how my political bubble stacks up against reality. I surveyed my network of colleagues, strategists, and friends and compared our media habits head-to-head with data from a major media consumption survey of nearly 5,000 voters my team conducted earlier this summer.
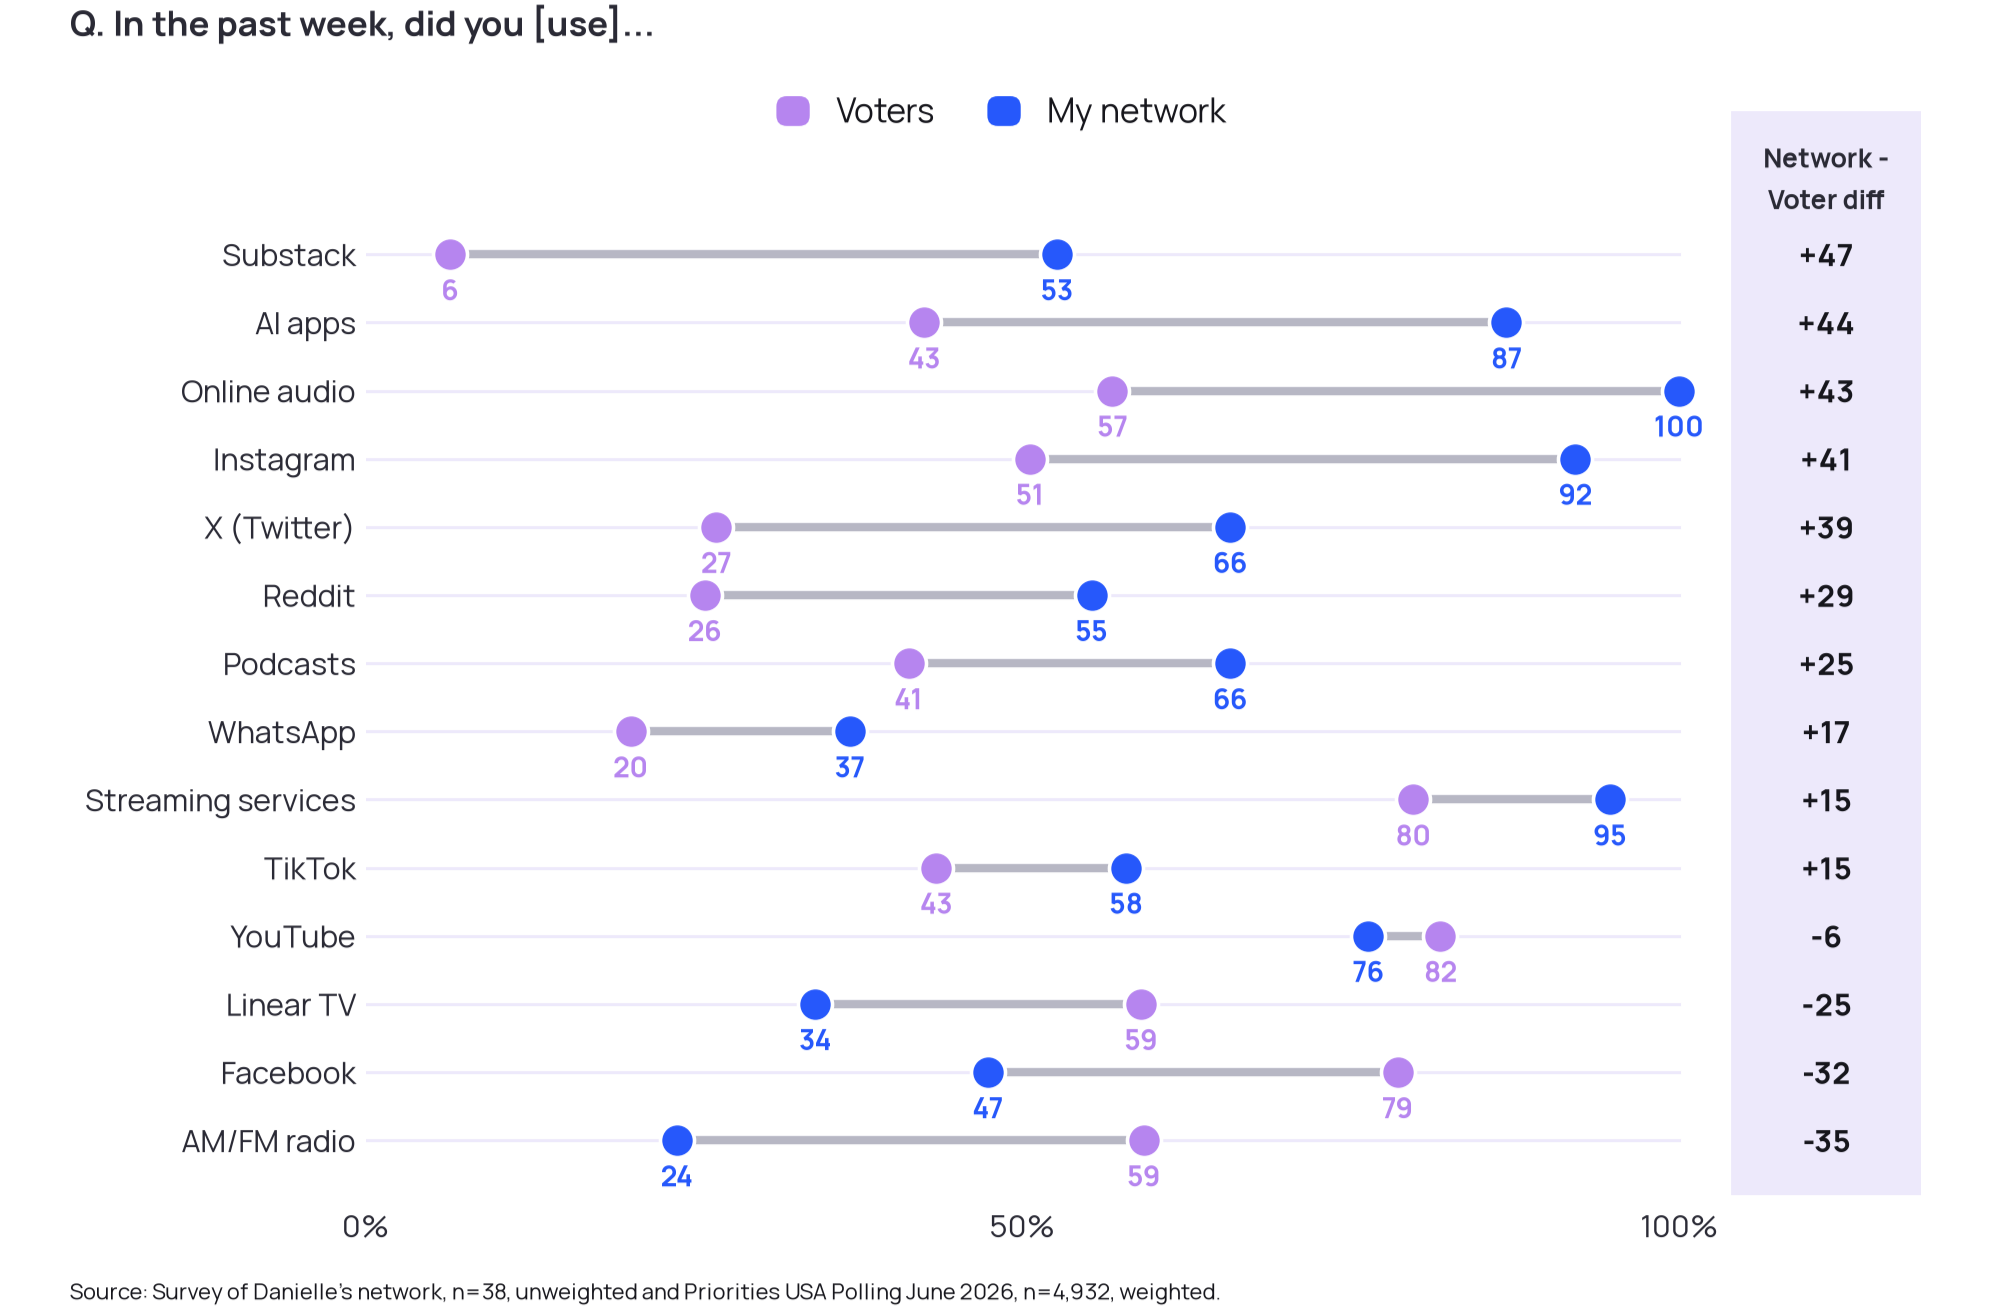
If you’re reading this on Substack, congratulations. You’re part of a very exclusive club. Just 6% of voters use Substack. In my network, it’s 53%.
More on that below, but first…
Digital ad spending, by the numbers:
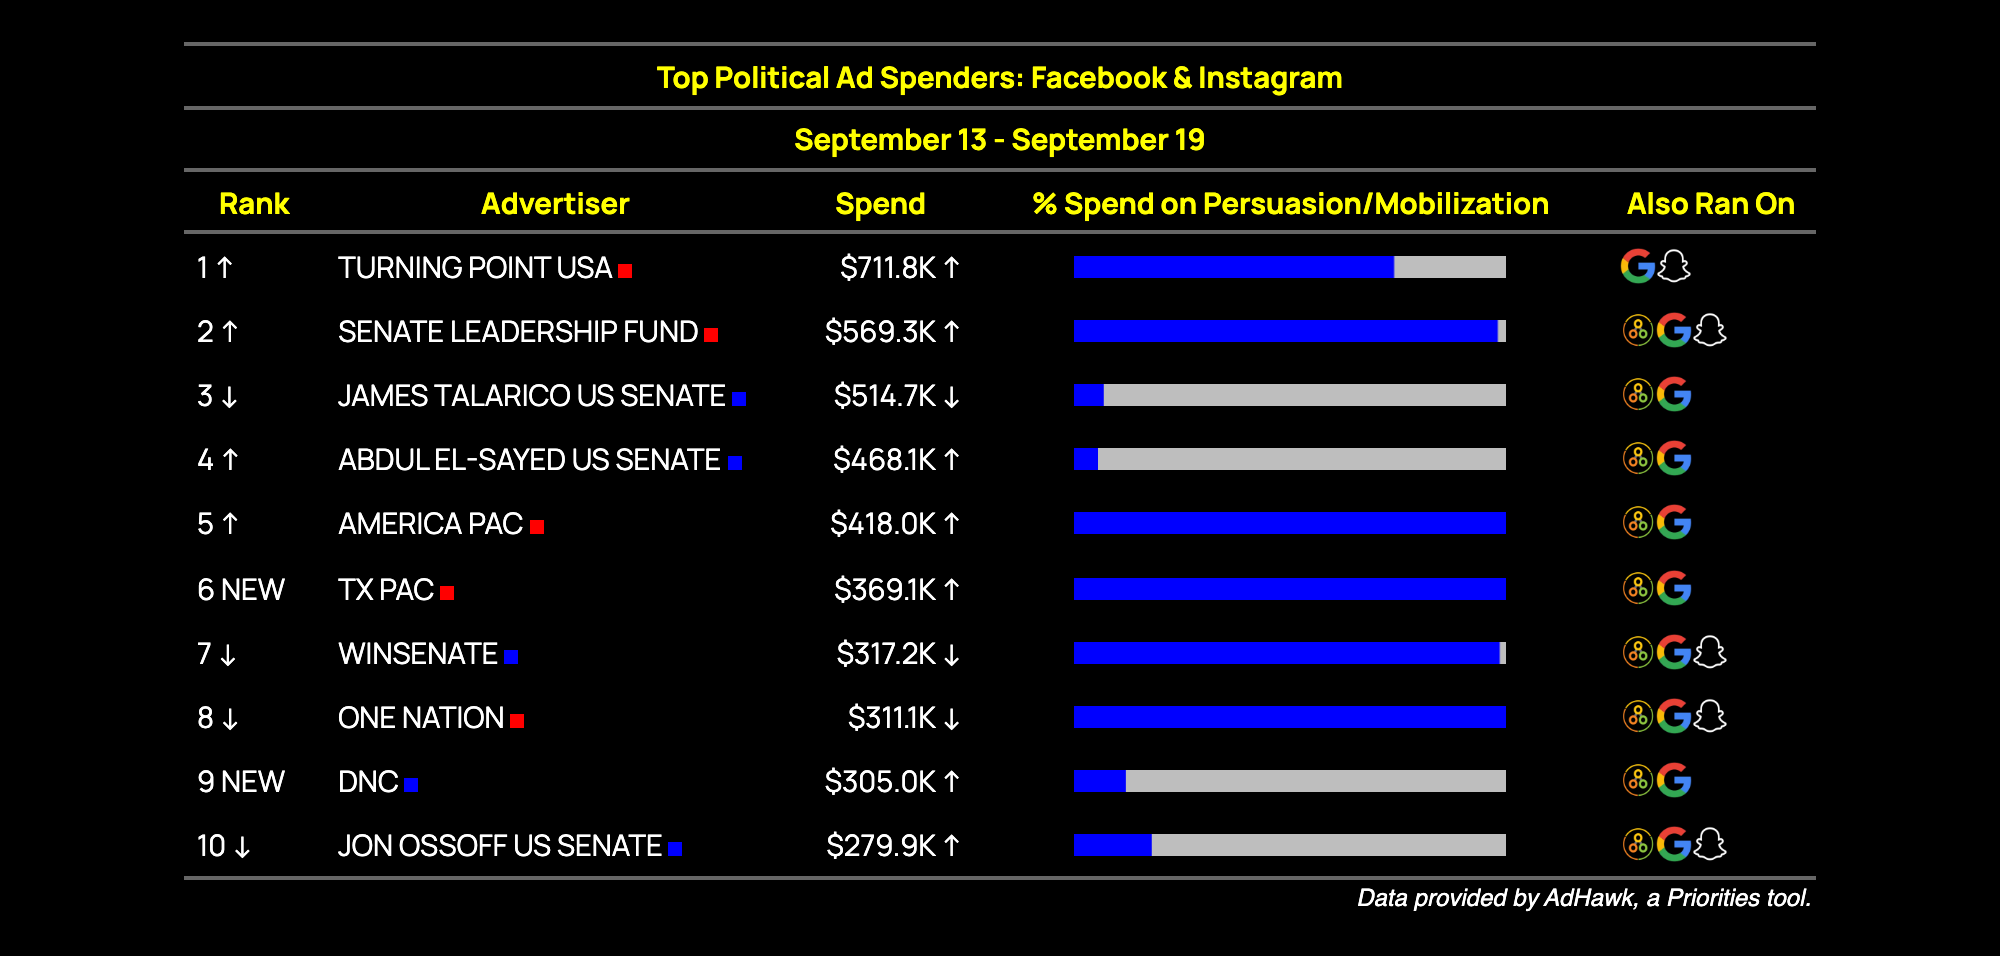
FWIW, U.S. political advertisers spent around $15 million on Facebook and Instagram ads last week. Here were the top ten spenders nationwide:
Turning Point USA is having a moment on digital as one of the key spenders in Arizona’s gubernatorial. They dropped $400k this week; that makes them the biggest GOP spender by a wide margin, and second overall (first? Navajo County Dems). For now, the candidates have taken a back seat: incumbent Governor Katie Hobbs (D) spent only $23k, while challenger Andy Biggs (R) spent $43k.
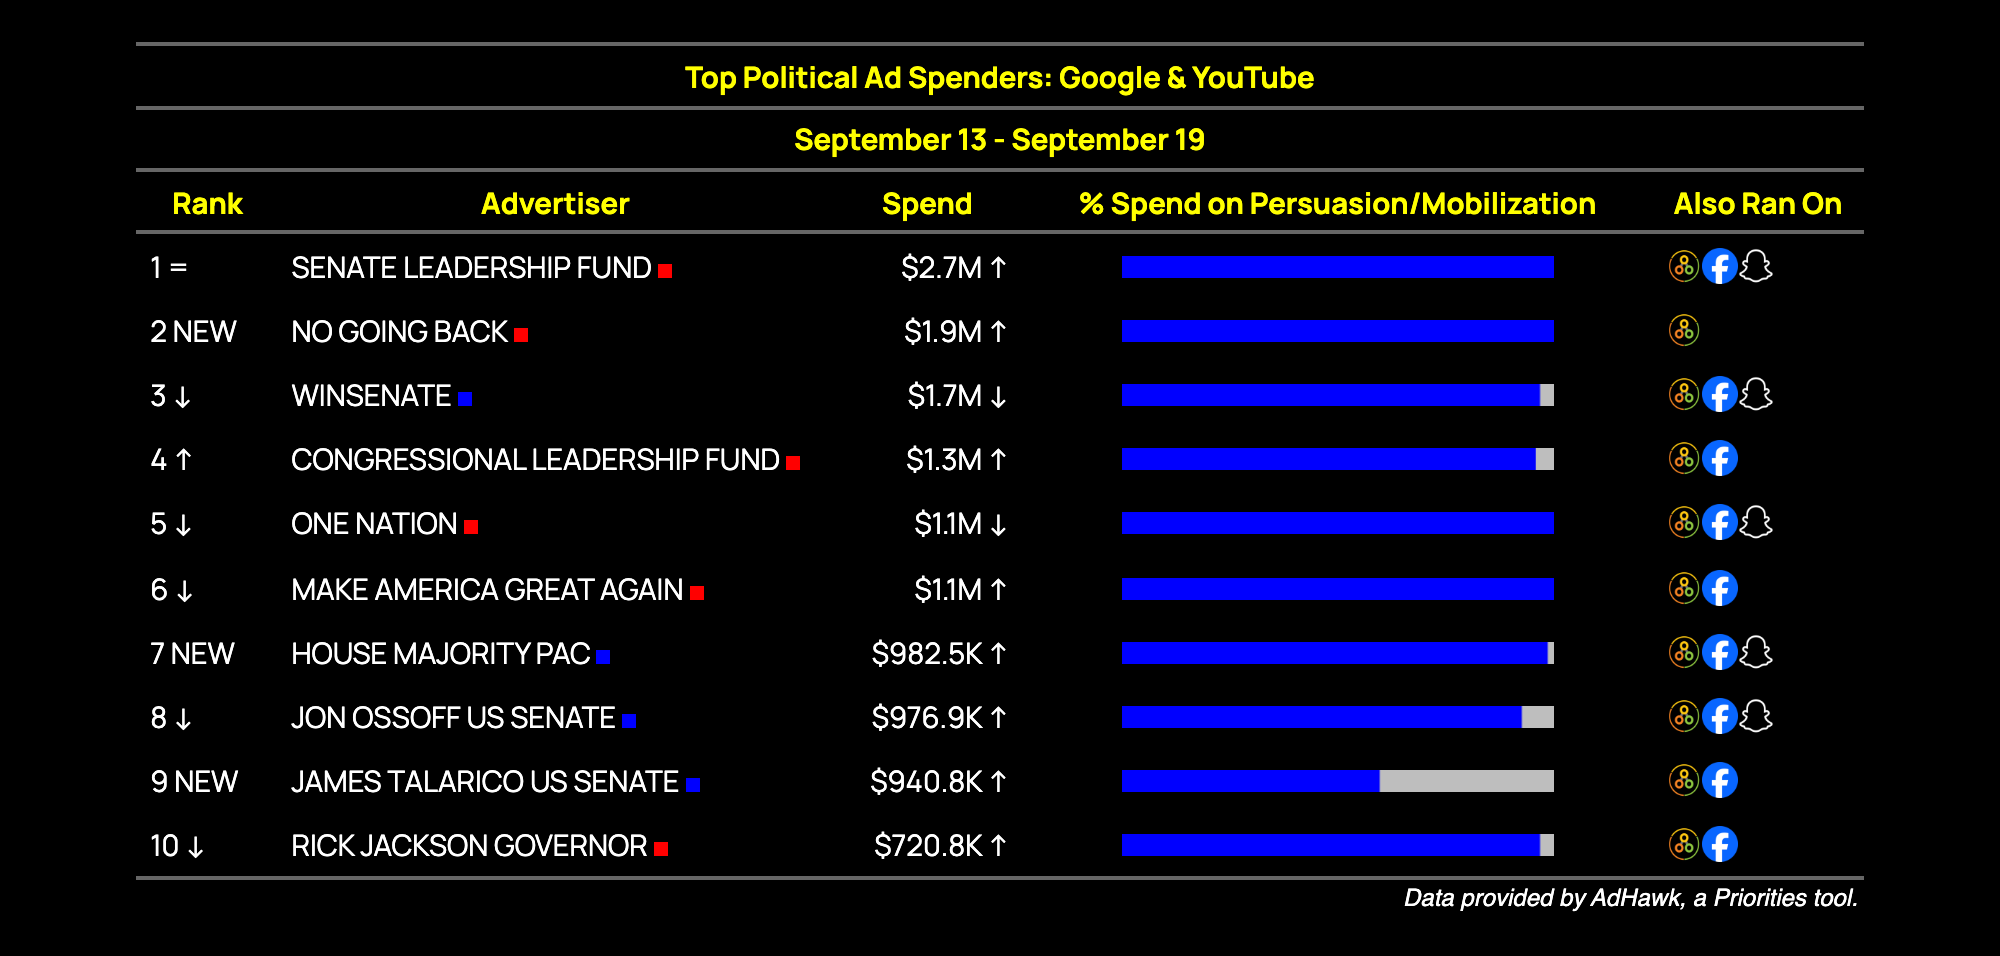
Meanwhile, political advertisers spent around $38 million on Google and YouTube ads last week. These were the top ten spenders nationwide:
Trump-aligned No Going Back rocketed into the no. 2 spot on Google this week. Last week, we focused mostly on the group’s Senate spending, but they’re also spending across thirteen key House districts. At the top of the list is MI-04, where they’ve put nearly half of their $280k spend behind this CTV creative.
Despite the massive war chest behind No Going Back, Trump continues to leverage every budget he has—including the US government—to gain an edge in the midterms. The spot has landed on CTV and Broadcast so far, reminiscent of the DHS buys last year.
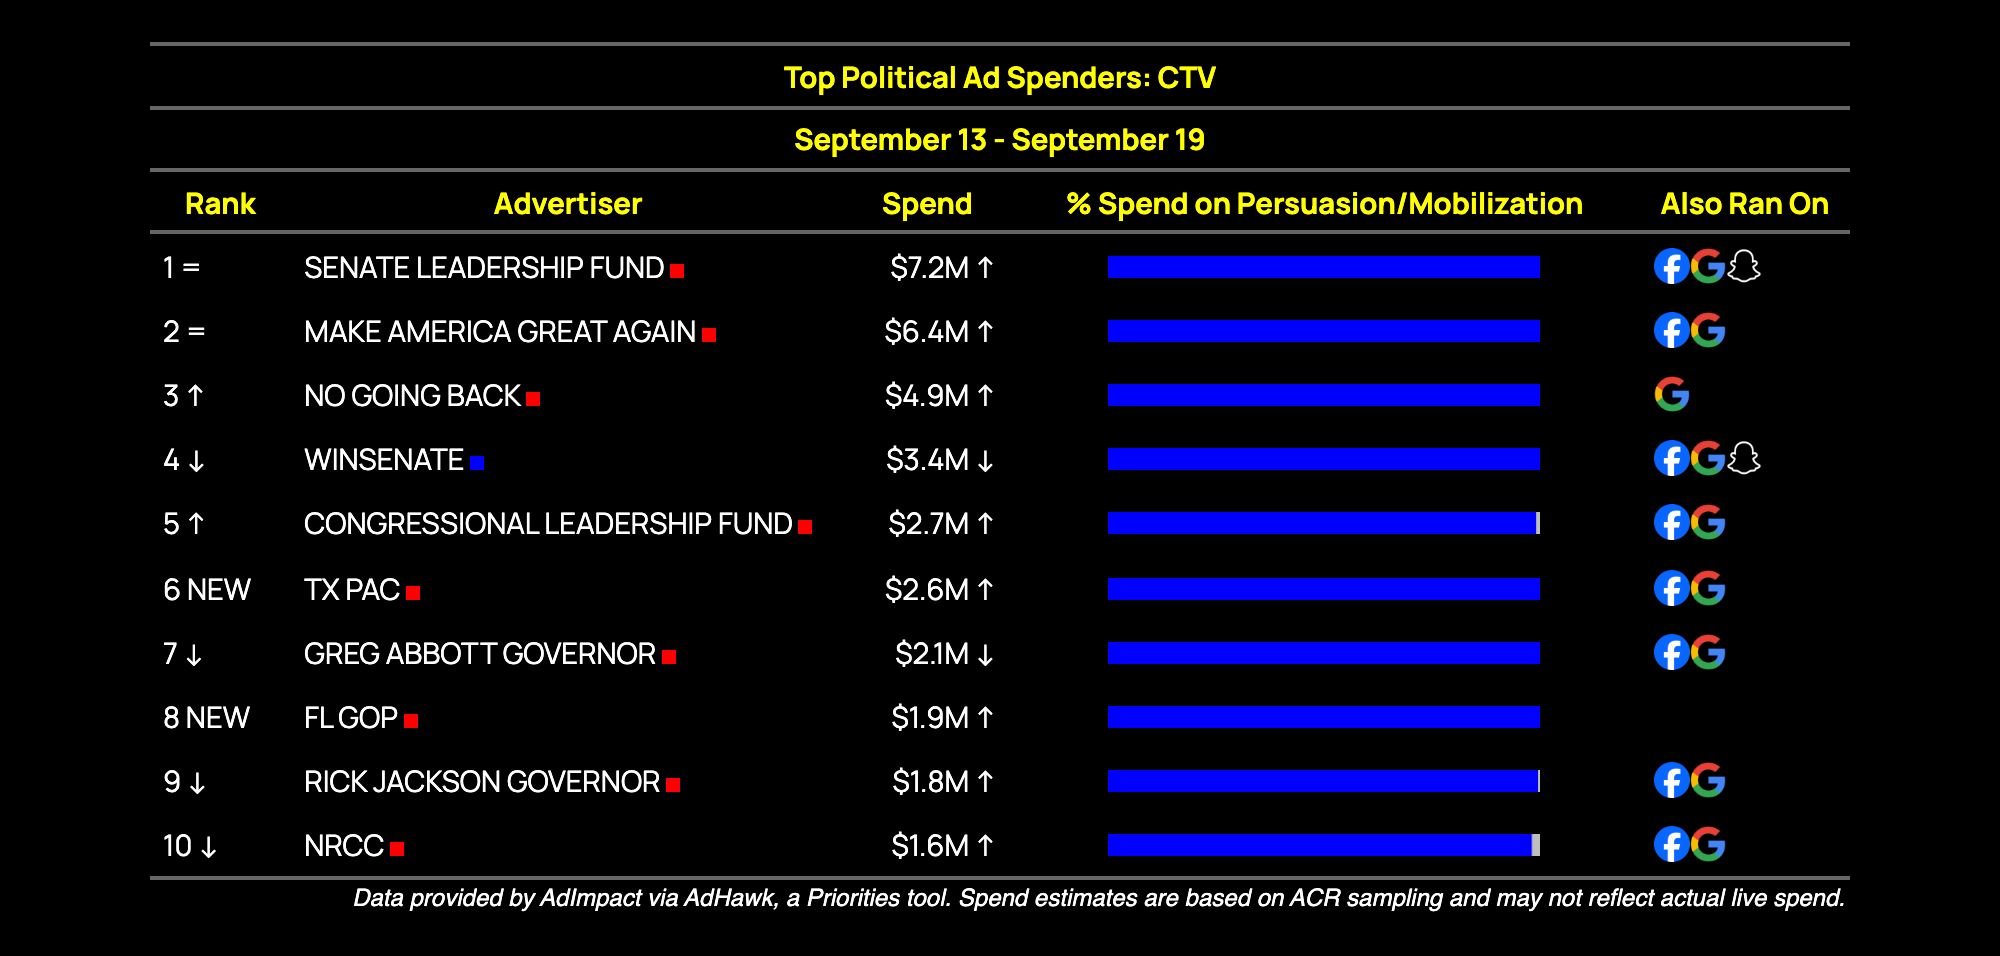
On CTV platforms, U.S. political advertisers spent an estimated $84 million last week. Here were the top ten spenders nationwide:
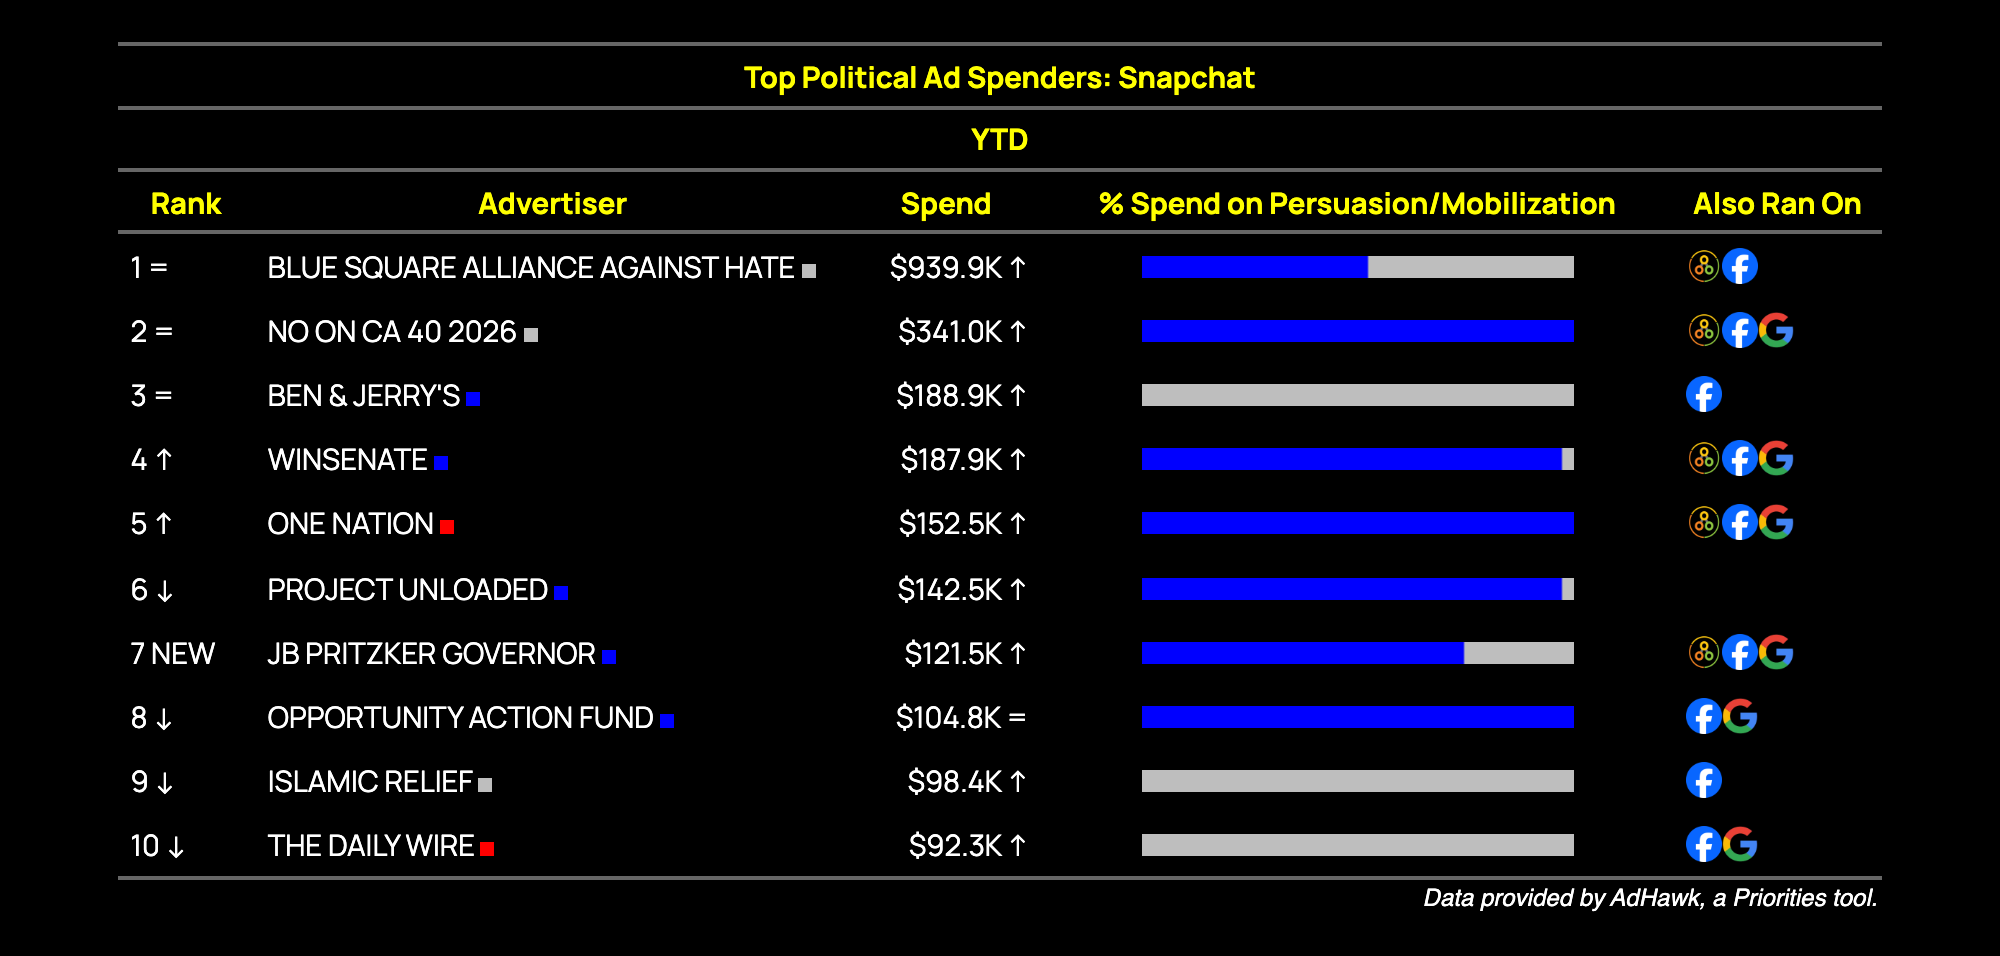
…and lastly, on Snapchat, here’s YTD data for the top 10 spenders:
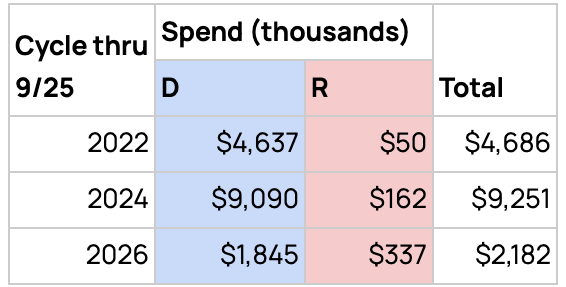
Snapchat is often an afterthought in competitive tactics, but there’s a trend worth watching: Republicans are investing heavily on the platform compared to past cycles.
According to our recent polling, 65% of voters ages 18-24 use Snapchat at least weekly. And its users are more likely to identify as independent or undecided. All this to say, Snapchat is a place where swing voters are hanging out. Do with that what you will.
The partisan spending gap has narrowed dramatically too. At this point in the 2022 cycle, the GOP faced a 90:1 spending disadvantage on Snapchat. This time around? It’s less than 6:1. Here’s a look at the cycle-by-cycle balance, courtesy of AdHawk:
Running out of time? Get political campaigns up and running with fast onboarding, guided campaign setup, and built-in tools that help you launch sooner. Learn more>
We all live in an information bubble.
Where Everyone’s Actually Hanging Out
Several years ago, my team set out to better understand voters’ media consumption habits. Now, alongside awesome partners like Equis, Climate Power, NEA, and others, we’re constantly in the field asking voters where they spend their time and how.
Whether we are conscious of it or not, we’re all biased toward our personal digital footprint: the creators we follow, the platforms we use, and what our algorithms show us. When we think about where “everyone else” hangs out online, it’s natural to make assumptions based on what’s popping up on our own screens.
That’s especially true for those of us who work in politics. If we understand how our personal screen time differs from the average voter, we can catch our natural biases and prevent them from affecting our campaign strategy.
So, it’s time for a little self-reflection. Here’s where my network spends time online compared to where voters do.
It’s no surprise to me that my network is heavy on platforms that tend to be a little long-winded and wonky, including Substack (as I mentioned), online audio like Spotify (100% vs. 57%), AI apps (87% vs. 43%), X (66% vs. 27%), and Reddit (55% vs. 26%).
Because many of those apps are open on our screens all day for work, it’s easy to subconsciously assume voters are using them the same way. Remember the “podcast election”? Turns out we’re the ones listening. Most voters are using the internet to stay connected and be entertained. Our work tools are not their hangout spots.Knowing that is step one.
This split is especially clear on social platforms. Nearly everyone I know is on Instagram (92% vs. 51%), but less than half of my peers use Facebook weekly (47% vs. 79%). Voters flip that: they’re far more likely to be on Facebook than on Instagram.
You’ll also notice my network leans away from linear TV and radio. Now, I don’t know anyone who thinks political campaigns are underinvesting in TV ads, but keeping an eye on broadcast still matters. It helps our team spot the core messages and narratives shaping viewers outside our own media bubbles.
YouTube: We’re All on the Same App, But the Vibes are Different
If you know me or my team, you know we can’t go five minutes without talking about how YouTube is the #1 place voters spend time online. Our YouTube usage looks pretty similar: roughly three-quarters or more of both groups use it, and overall video streaming hits 80–90% across the board.
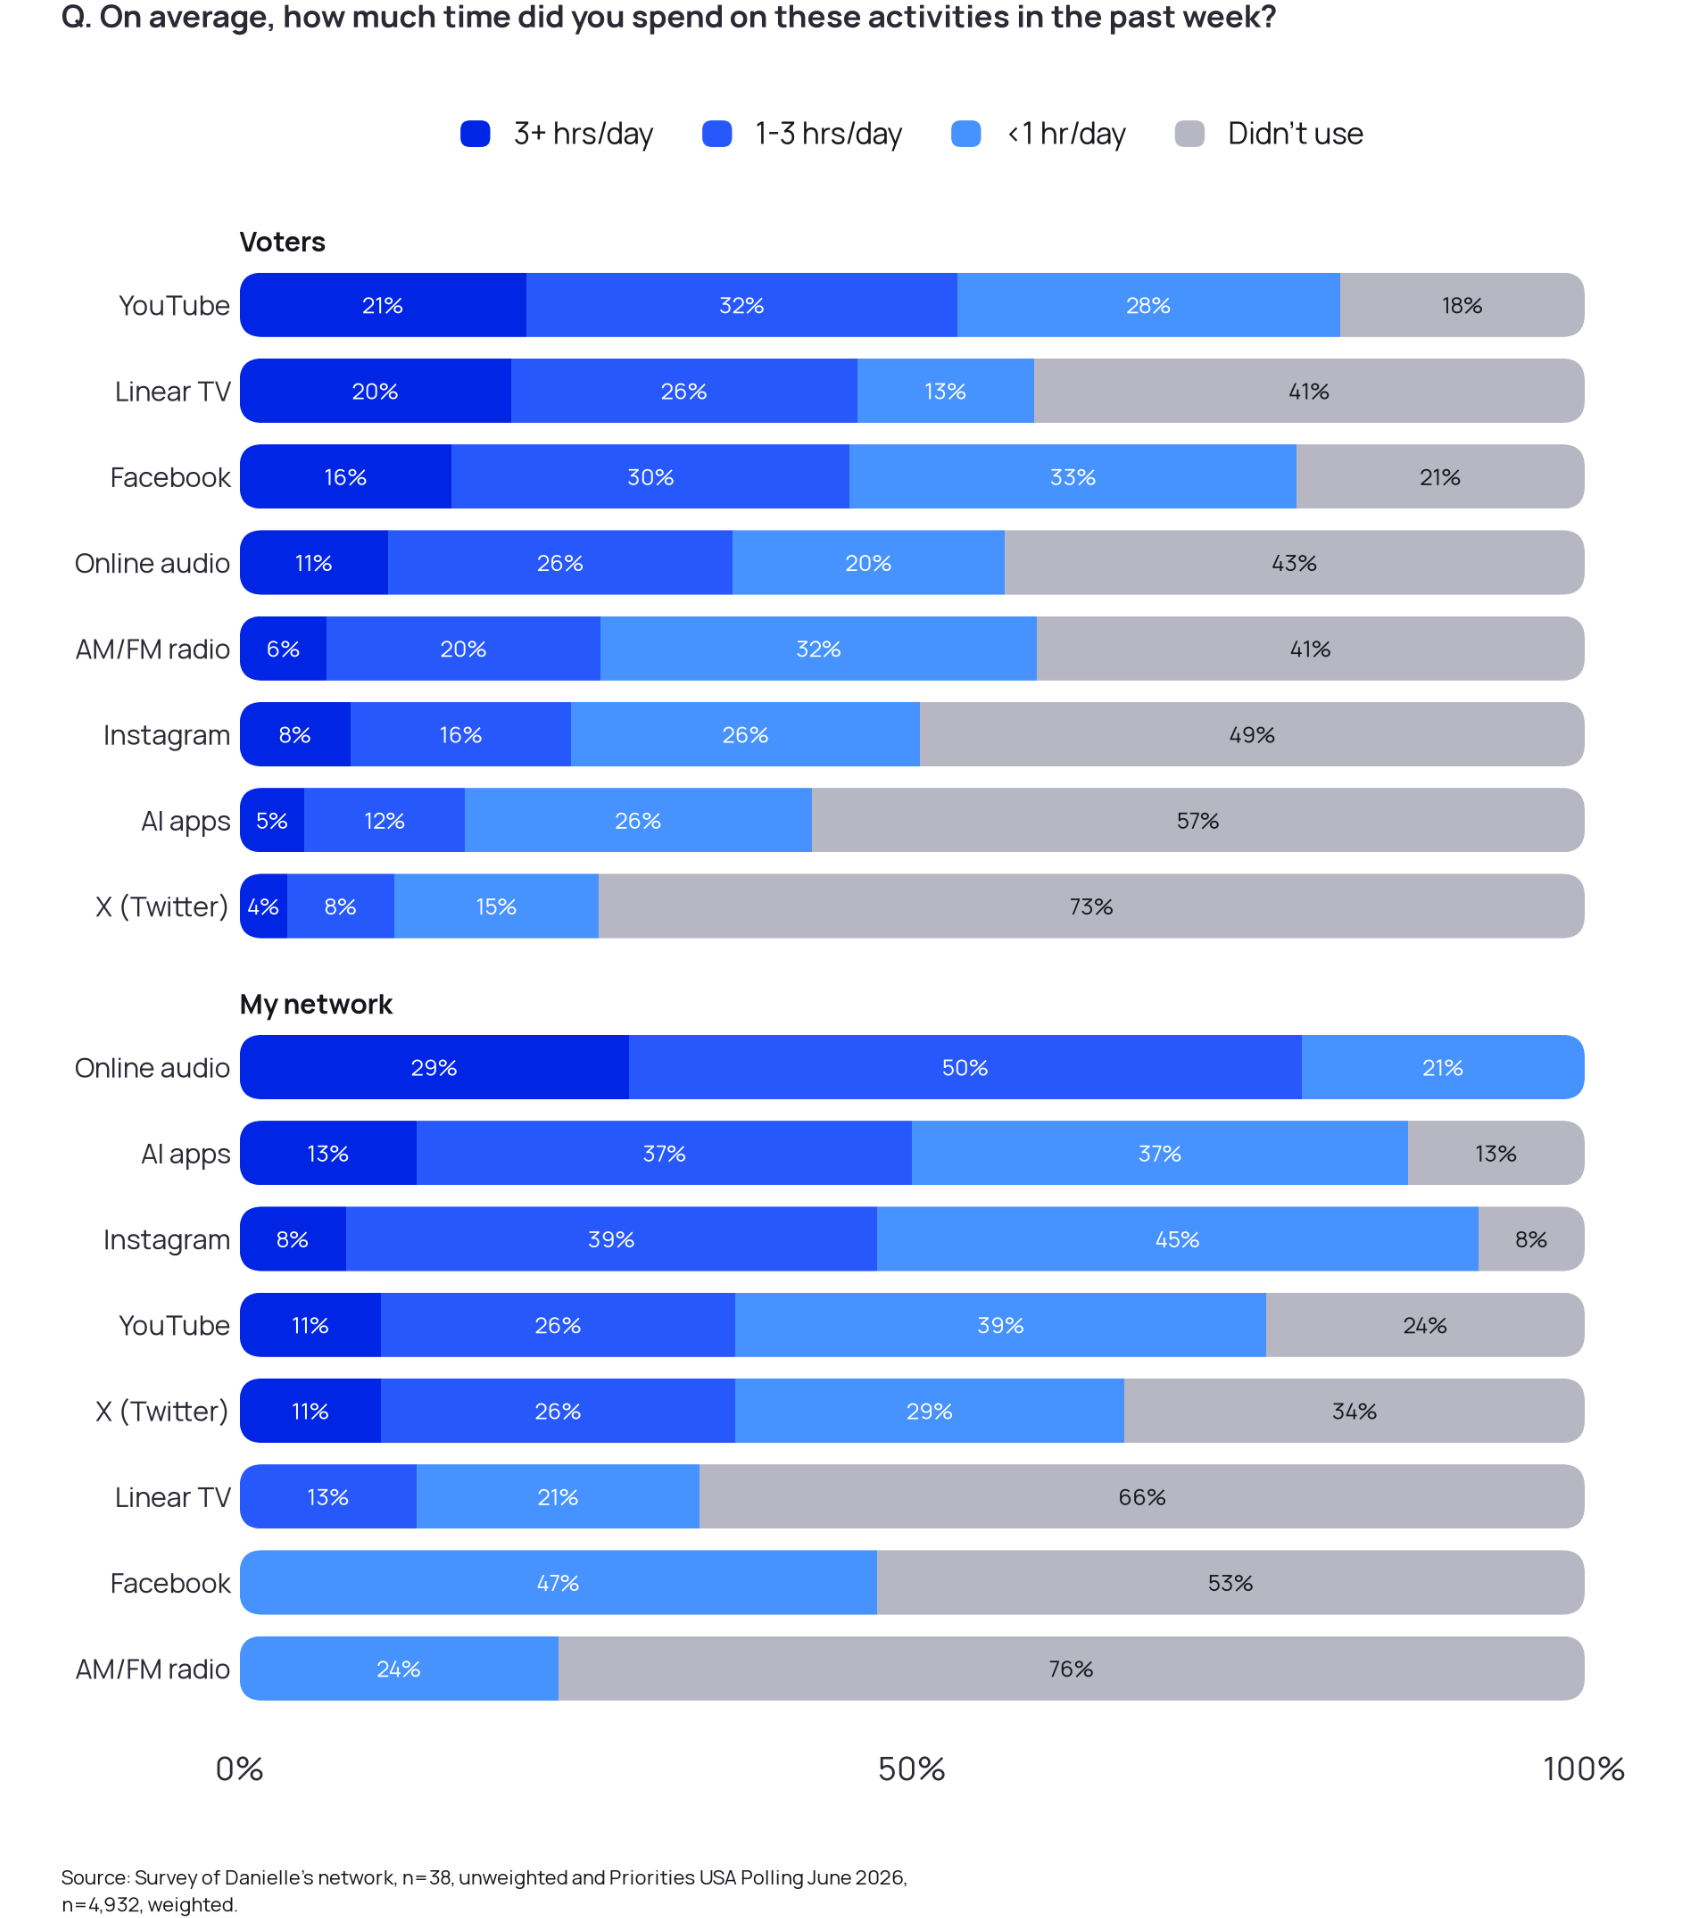
So if we’re all on YouTube, what’s the difference? It’s how and why we watch. I tend to use YouTube as a quick catch-up tool—pulling up a news clip, policy breakdown, or bit of commentary on my phone or laptop. But for voters, it’s often the main screen. 53% of voters spend an hour or more a day on YouTube, compared with 37% of my network.
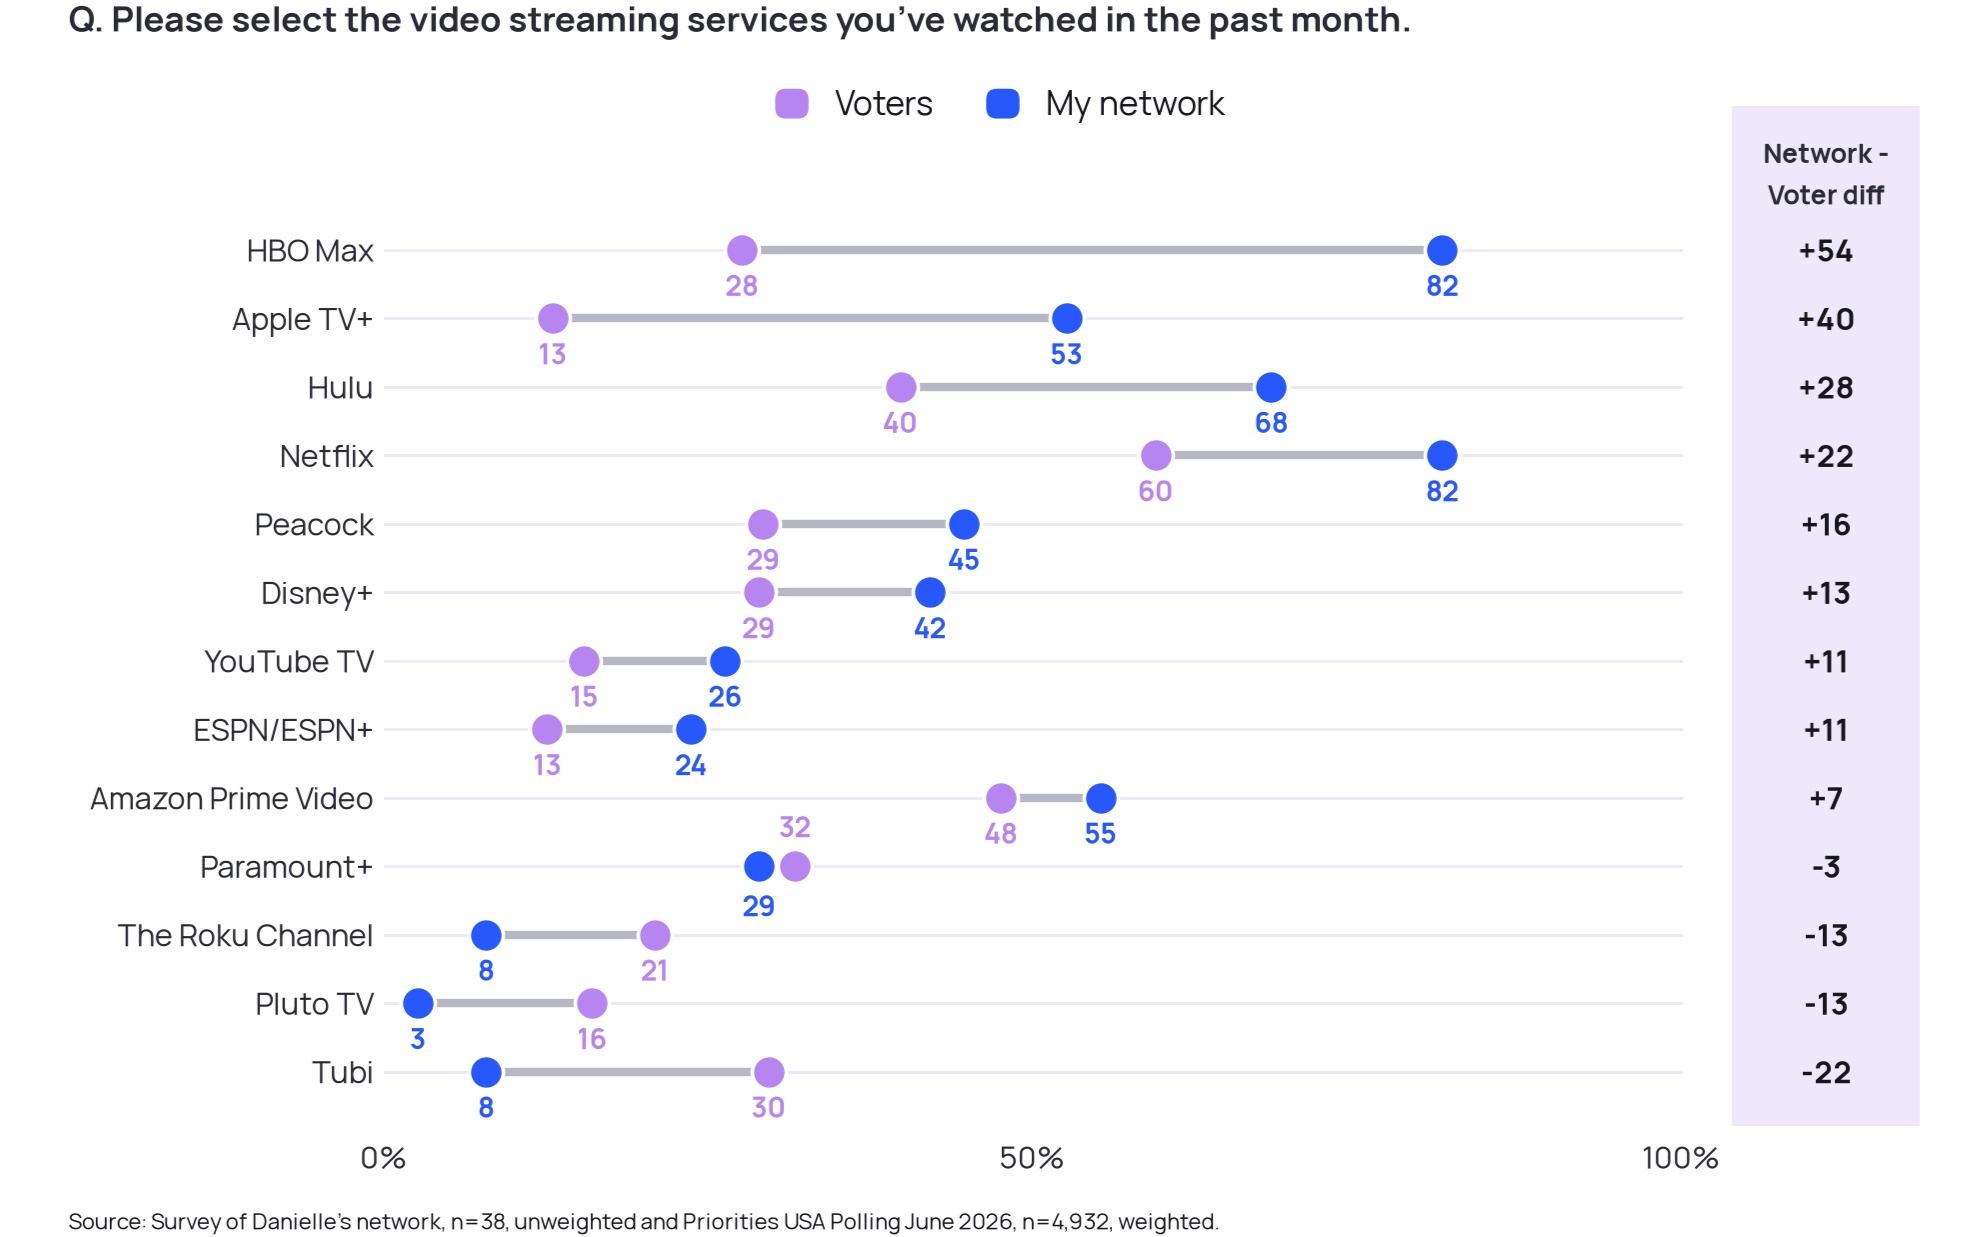
Streaming platforms show another clear divide. My Slack channels are regularly blowing up with chatter about award-winners on prestige shows like Widow’s Bay and Hacks. So seeing that we stack up subscriptions like HBO Max, Hulu, and Apple TV was no surprise.
But millions of voters are getting their entertainment somewhere else: free platforms where targeted ads reach them right in their living rooms, including Tubi (30% vs. 8%), The Roku Channel (21% vs. 8%), and Pluto TV (16% vs. 3%).
Screen Time Confessions
Logging onto an app is one thing. Where we actually spend our hours is where the real gap shows up. To see how deeply these habits run, we asked people how much time they spend on each platform in an average week.
When you look at who’s spending serious time on these platforms, geography, age, and lifestyle likely explain some of the divide.
My network—the same people who took this survey and the ones I talk to every day—is mostly under 50, and 71% of us live in urban centers like Chicago, New York, and D.C. We spend an hour or more a day on online audio like Spotify and podcasts, AI tools, Instagram, and X.
On the flip side, nearly half of my network (47%) uses Facebook, but not one of us spends an hour or more a day on it. Among voters, 46% do. Facebook might feel like a ghost town to some of us, but for voters, it’s still a watering hole they frequent. And while our research shows that vertical video is reaching more and more generations, it’s happening on different platforms: Instagram for those under 50, and Facebook Reels for those over 50.
The same goes for AM/FM radio. Not a single person in my network listens for an hour or more a day, compared to 26% of voters. And just 13% of us watch an hour or more of linear TV a day, as opposed to 46% of voters.
Some of this is easy to explain. People in cities are more likely to take the train or walk, so we don’t spend much time in the car with the radio on—unlike the 77% of voters who say they live in a suburban or rural area. (Ok, if I’m being 100% honest, I’m guilty of taking a few Lyfts a week, but you can bet I have a podcast or Spotify in my ears.)
What We’re Watching When We Turn Off The News
Now for the fun part: what we’re all watching when we’re not doomscrolling.
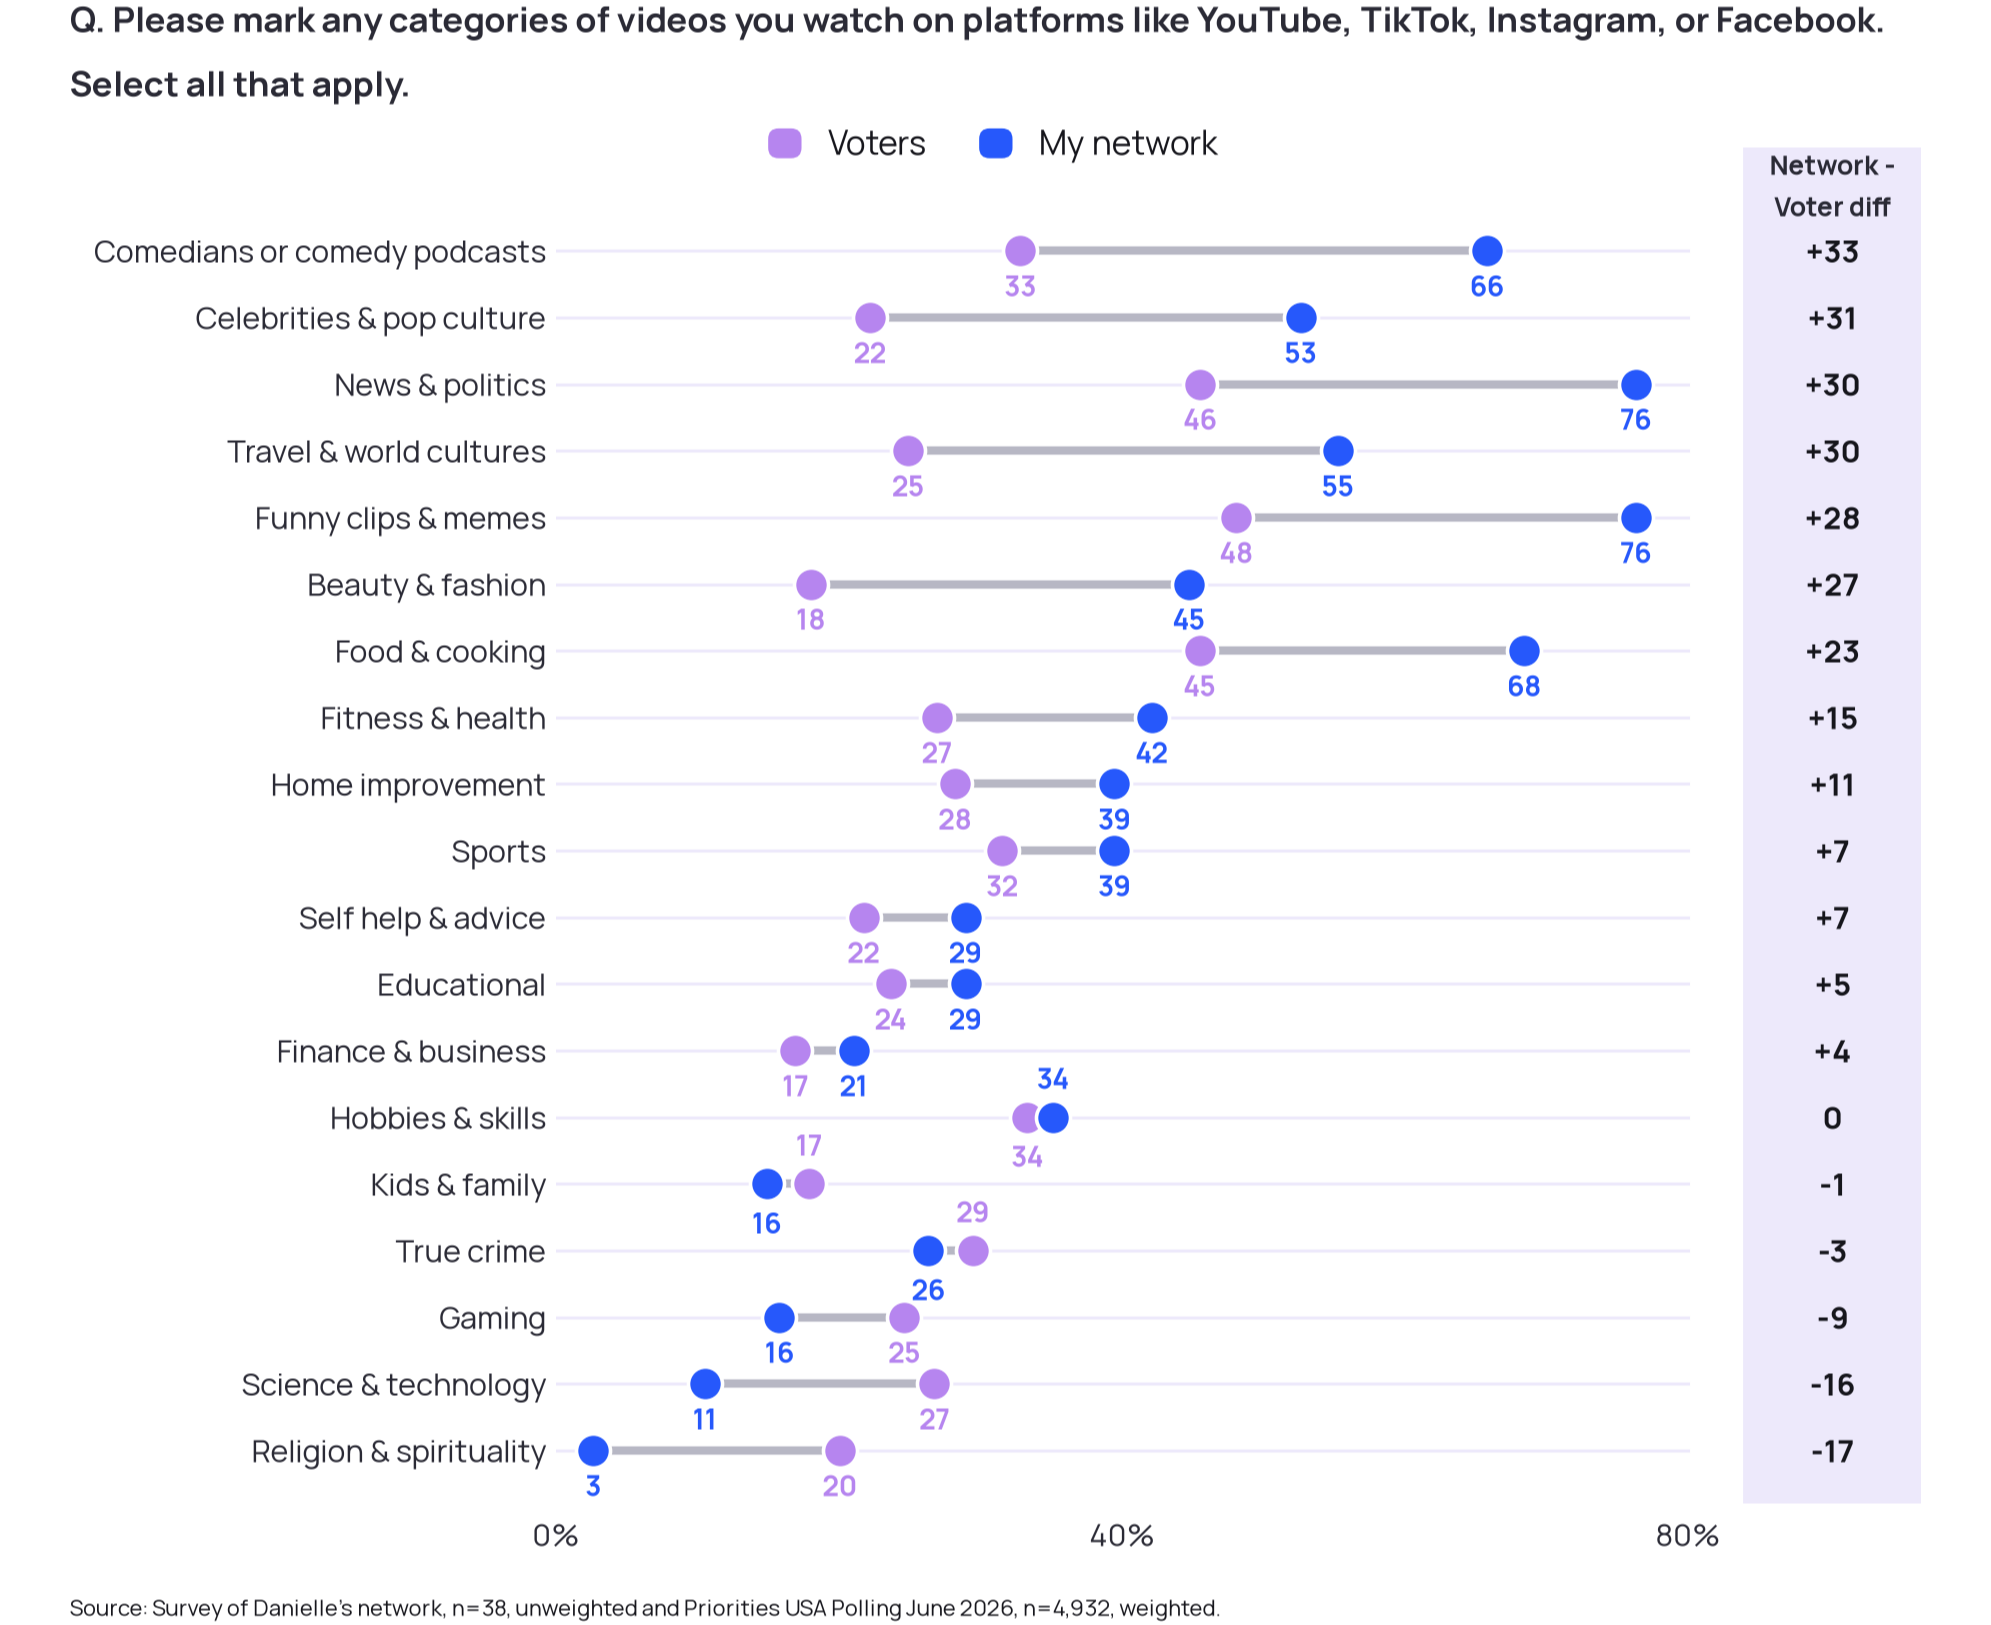
First off, my network was more likely to select just about every category. A bunch of political internet nerds over-engaging with a survey? Shocker. My network overindexed on comedy podcasts (hey, Democrats need to be funnier so maybe this is all of us doing our homework!), news and politics, pop culture commentary, travel and world culture, food and cooking, and beauty tutorials. Meanwhile, our voters overindexed on religion and spirituality, science and technology, and gaming.
To get a better sense of our off-the-clock digital lives, I asked my network to describe the types of content they’re watching in these more entertainment-centric categories. They did not hold back. A few highlights:
“Late 20s/early 30s ‘city girl’ finance and home remodeling influencers”
“Direct-to-consumer ‘here’s how I made my first million’ videos.”
“Comedians who are anti-Joe Rogan (like Gianmarco Soresi or Josh Johnson)”
“Chain restaurant order mukbangs, DUI bodycam videos, and Summer House recaps”
Politics Is Our Personality (Voters, Not So Much)
This is the number that really caught my attention: 87% of my network says politics is “very important” to their personal identity, compared to just 30% of voters.
And more than half of voters surveyed (54%) either stumble across political news passively (42%) or actively avoid it (12%). Sound familiar? I did a whole post on this last month.
Not a single person in my network reported avoiding political news. That’s partly because we genuinely enjoy it, but also because it’s literally in our job descriptions.
Demographics explain a big part of this disconnect: 64% of voters don’t have a bachelor’s degree, while the rate among colleagues in my field is much higher. When your job revolves around policies and politicians, it forces you to stay up to date on what’s happening in the news. It’s easy to forget that most people aren’t spending their time tracking whatever crazy thing Trump and his cronies are doing on a given day.
When I asked my network in open-ended prompts what political news topics they’d recently encountered online, the answers were… revealing:
“Data center energy buildout and power grid strain”
“SCOTUS White House ballroom ruling and Trump’s $1 coin”
“Missouri redistricting, DSA candidate backlash, and 2028 primary speculation”
“USPS system changes affecting mail-in voting”
Trump’s $1 coin? We really do follow everything.
The truth is, we track legal rulings the way sports fans track trade deadlines. But while the average voter is keeping up with the news, they’re not necessarily following it with our level of granularity. Real world issues like gas prices and cost-of-living pressure break through, as do major international headlines like the war in Iran.
What Keeps Us All Up at Night
Our media diets and backgrounds may be different, but when we asked about issues people were very concerned about, one in particular stood out: AI. Both groups showed similar levels of concern around fake AI photos/audio and AI data center growth. Given what we’re seeing in other research and reporting, I’d expect that concern to keep growing. Still, for voters, the cost of gas, electricity, and utilities ranked as the biggest concern overall.
If we want our campaigns to land outside our own group chats, we have to connect not just with the issues that are top of mind, but with the social and information environments where voters actually spend their time.
We’re all living in different, algorithm-driven online worlds, and my network clearly has a few major blind spots. Voters aren’t going to break into our bubble to find us. We have to build plans that meet them where their lives are happening.
So, fellow members of the exclusive Substack club: close a few tabs. And maybe even open Facebook… just for research.
Running out of time? Get political campaigns up and running with fast onboarding, guided campaign setup, and built-in tools that help you launch sooner. Learn more>
That’s it for FWIW this week. This email was sent to 25,868 readers. If you enjoy reading this newsletter each week, would you mind sharing it on X/Twitter, Threads, or Bluesky? Have a tip, idea, or feedback? Reply directly to this email.